
Welcome to The Griffin Real Estate Market Update,
If you’re thinking about buying or selling residential real estate, it’s important to understand the current market trends.
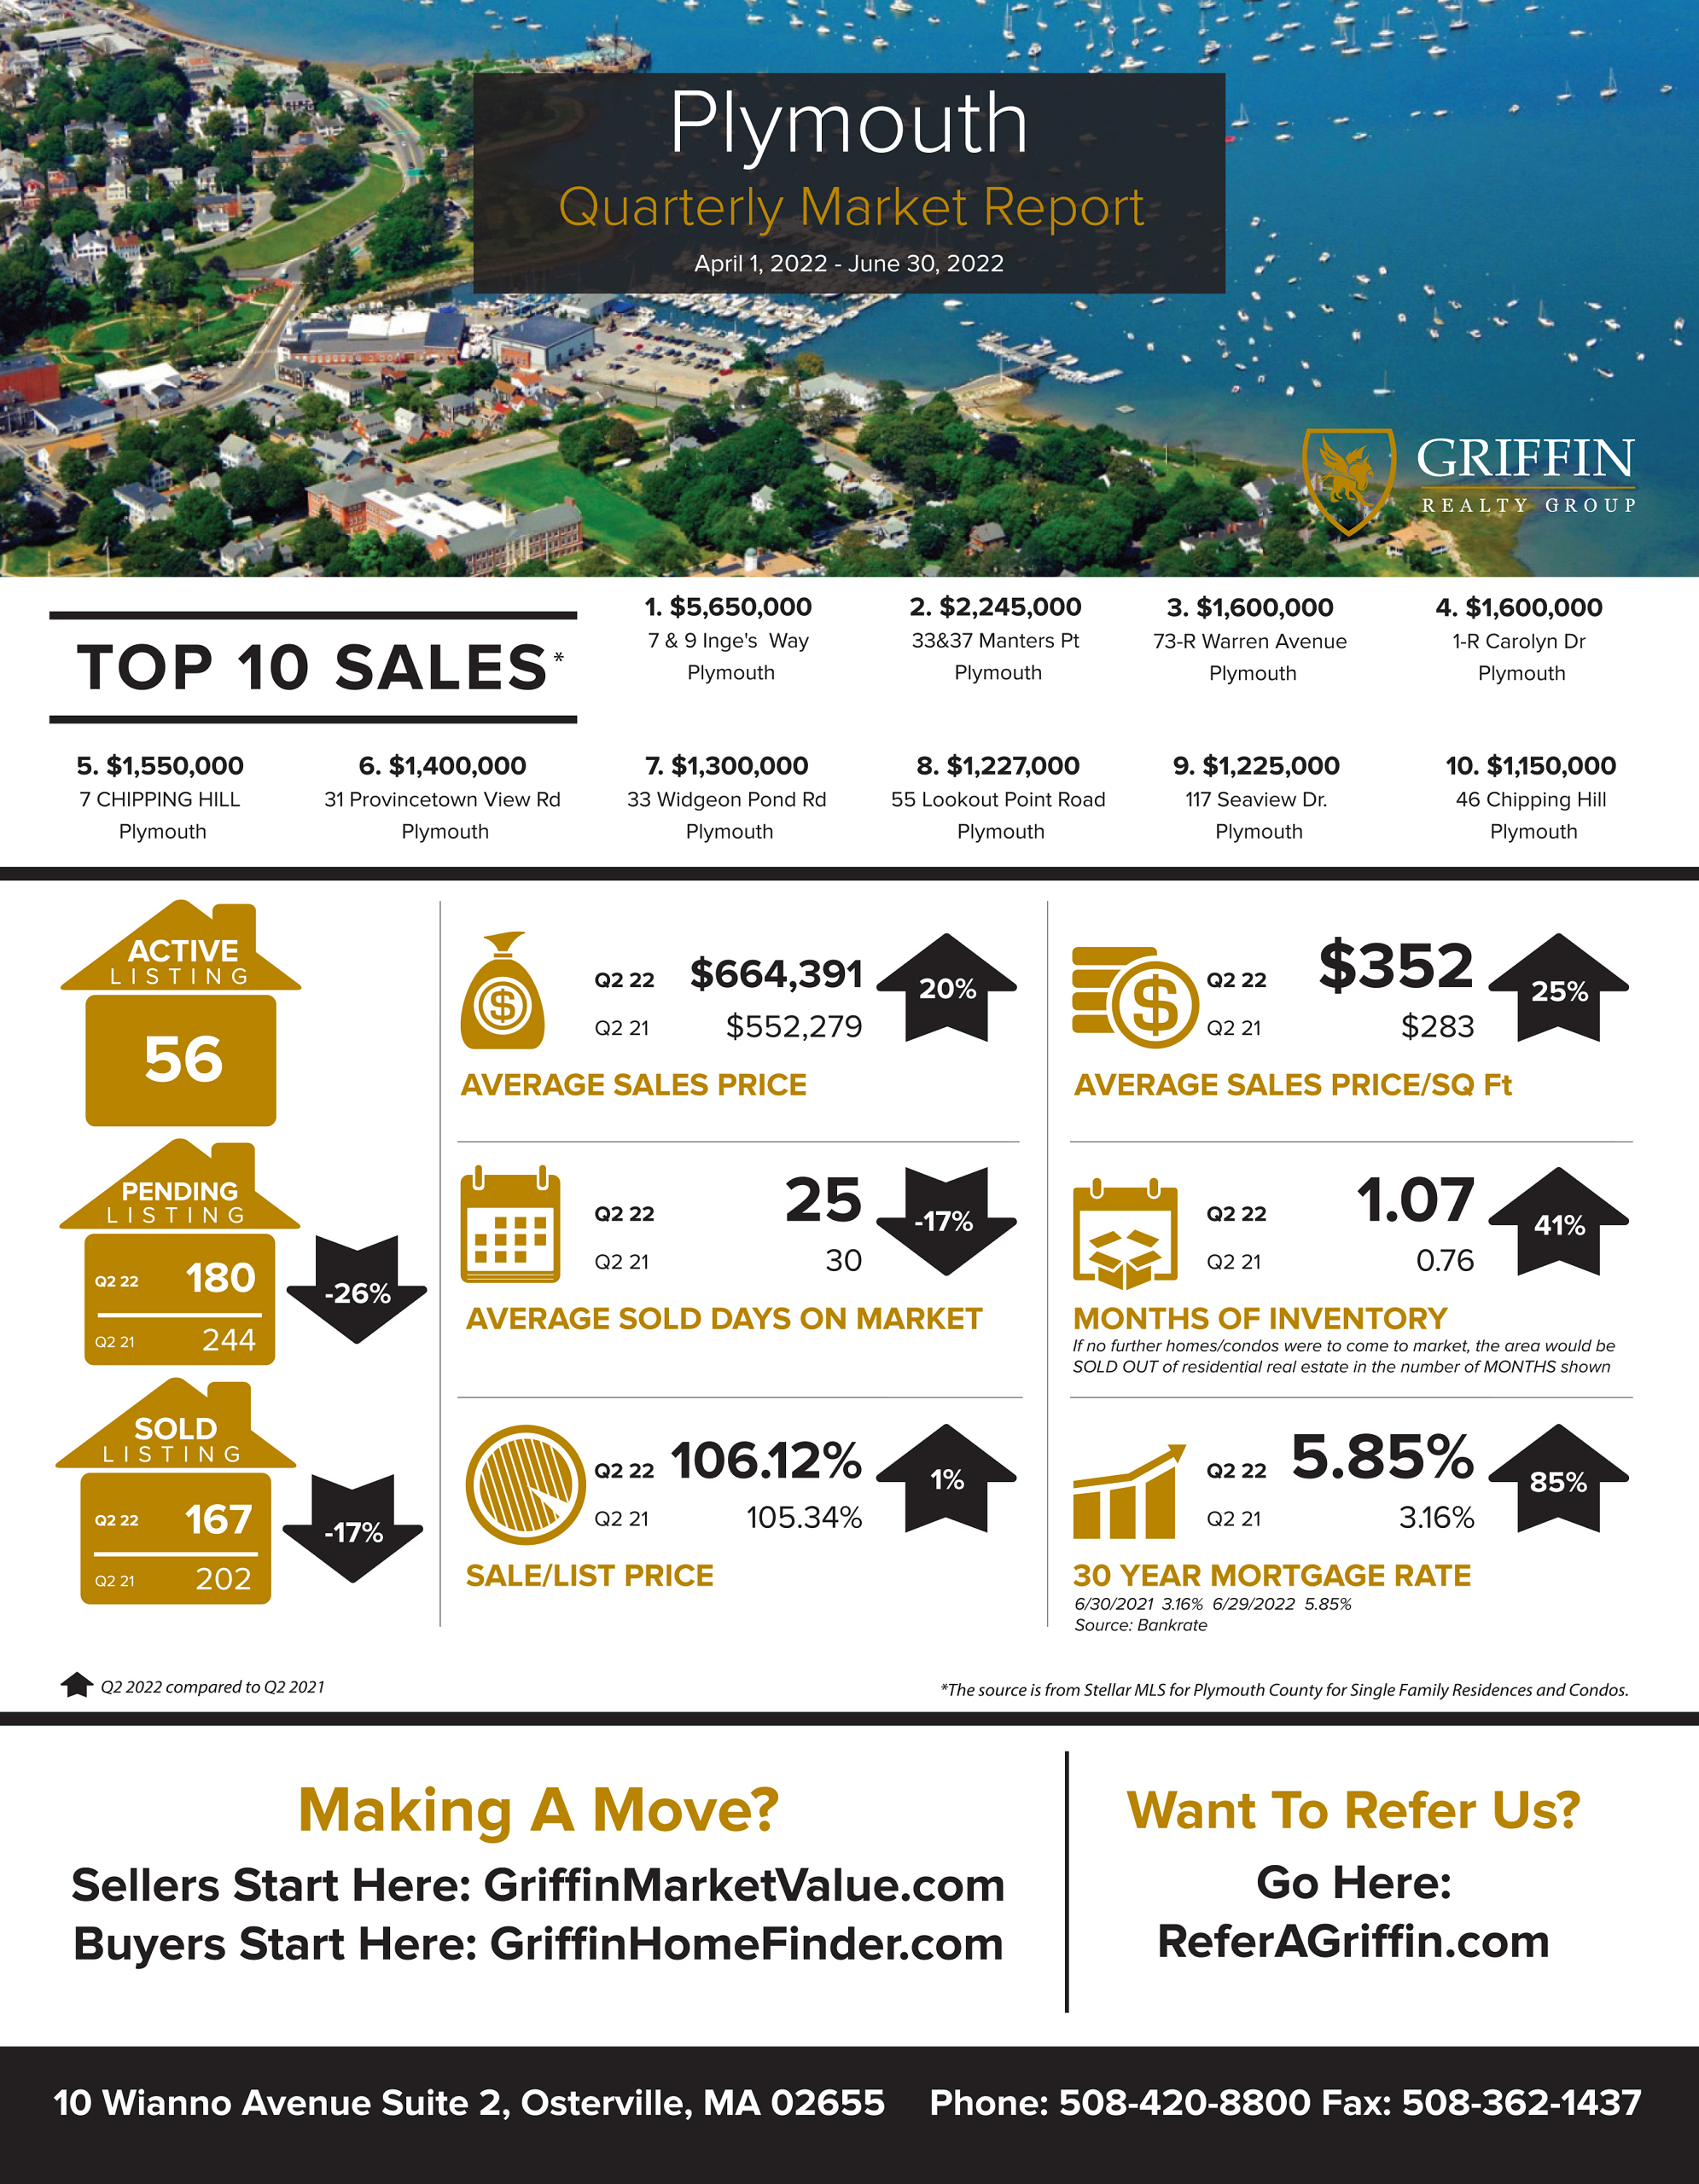
According to MLSPIN, the marketplace for Boston residential properties, here’s what happened in Q2 2022 versus Q2 2021:
The Number of SOLD listings decreased by 17% to 167 properties with a top sale of $5.65 million at 7 & 9 Inge’s Way in Plymouth.
The Average Sales Price increased by 20% to $664000 moving the Average Price Per Square Foot up to $352 per square foot.
The inventory of properties available for sale as measured in months supply increased by 41% to 1.07 months worth of properties for sale.
The average 30 year fixed mortgage rate increased to 3.16% according to Bank Rate.com.
Thanks for tuning in, we’ll see you in the next Griffin Real Estate Market Update.
Boston
Average Sales Price
Q2 2021 – $552279.02
Q2 2022 – $664391.32
increased by 20%
Average Days On Market
Q2 2021 – 30
Q2 2022 – 25
decreased by 17%
Average Sale Price Per Square Foot
Q2 2021 – $282.79
Q2 2022 – $352.48
increased by 25%
Sale to List Price Ratio
Q2 2021 – 105.34%
Q2 2022 – 106.12%
increased by 1%
Number of Sold Listings
Q2 2021 – 202
Q2 2022 – 167
decreased by 17%
Months Supply of Inventory
Q2 2021 – 0.76
Q2 2022 – 1.07
increased by 41%
Mortgage Rate
Q2 2021 – 5.85%
Q2 2022 – 3.16%
85% increased
Top 10 Sales
- $5650000 7 & 9 Inge’s Way Plymouth, MA
- $2245000 33&37 Manters Pt Plymouth, MA
- $1600000 73-R Warren Avenue Plymouth, MA
- $1600000 1-R Carolyn Dr Plymouth, MA
- $1550000 7 CHIPPING HILL Plymouth, MA
- $1400000 31 Provincetown View Rd Plymouth, MA
- $1300000 33 Widgeon Pond Rd Plymouth, MA
- $1227000 55 Lookout Point Road Plymouth, MA
- $1225000 117 Seaview Dr. Plymouth, MA
- $1150000 46 Chipping Hill Plymouth, MA
GRAB OUR FREE COURSES 6 Steps To Home Buyer Success – http://griffinbuyercourse.com 7 Steps To Home Seller Plan – http://griffinsellercourse.com 8 Steps To Agent Success – http://griffinagentcourse.com


