Construction on the new Sagamore Bridge is set to begin in late 2027. That is no longer a rumor or a projection. MassDOT has completed foundation load testing, is finalizing the selection of the design-build contractor, and expects to award a construction contract by the end of this year. The crane you saw looming over […]
Last week I wrote that the easy market was over. That prices were falling, inventory was rising, and the Fed had threatened to make it worse. I did not expect to be back this week with an even harder message. Yesterday, President Trump declared the Iran ceasefire “over.” US forces struck Kharg Island — Iran’s […]
I want to talk about something I have been watching for several months — something that is showing up in my conversations with buyers, in sellers’ behavior, and in the competitive intelligence I get from firms across the market. The data is just now confirming what experienced agents have been feeling since early spring. The […]
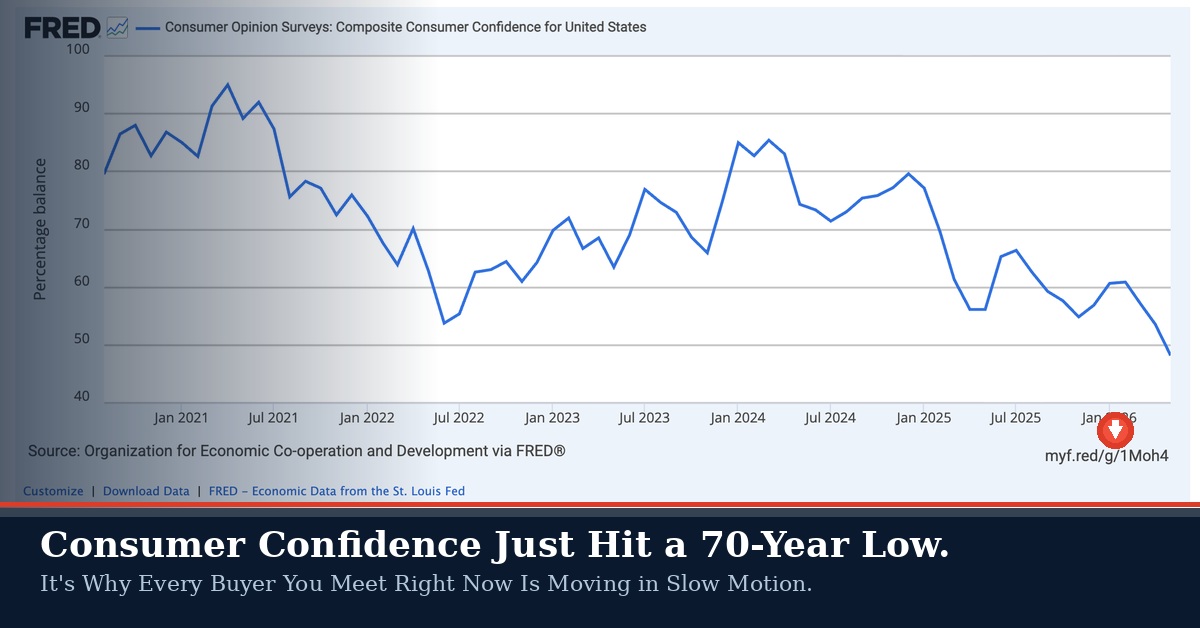
There is a chart I want you to look at before we talk about anything else. It is the OECD Composite Consumer Confidence Index for the United States, sourced from the Federal Reserve’s FRED database. It tracks how Americans feel about the economy, their finances, and their prospects — going back to the early 1960s. […]
Kevin Warsh held his first press conference as Federal Reserve Chair this afternoon. Markets did not like what they heard. The Dow dropped over 500 points. The S&P fell more than 1%. Two-year Treasury yields jumped 16 basis points — the highest level in over a year. The dollar surged. Gold cratered. And if you […]
If you are buying or selling a luxury home in Boston or on Cape Cod, the most important decision you will make has nothing to do with the property itself. It is the decision about who you trust to guide you through it. That might sound like an obvious thing for a real estate firm […]
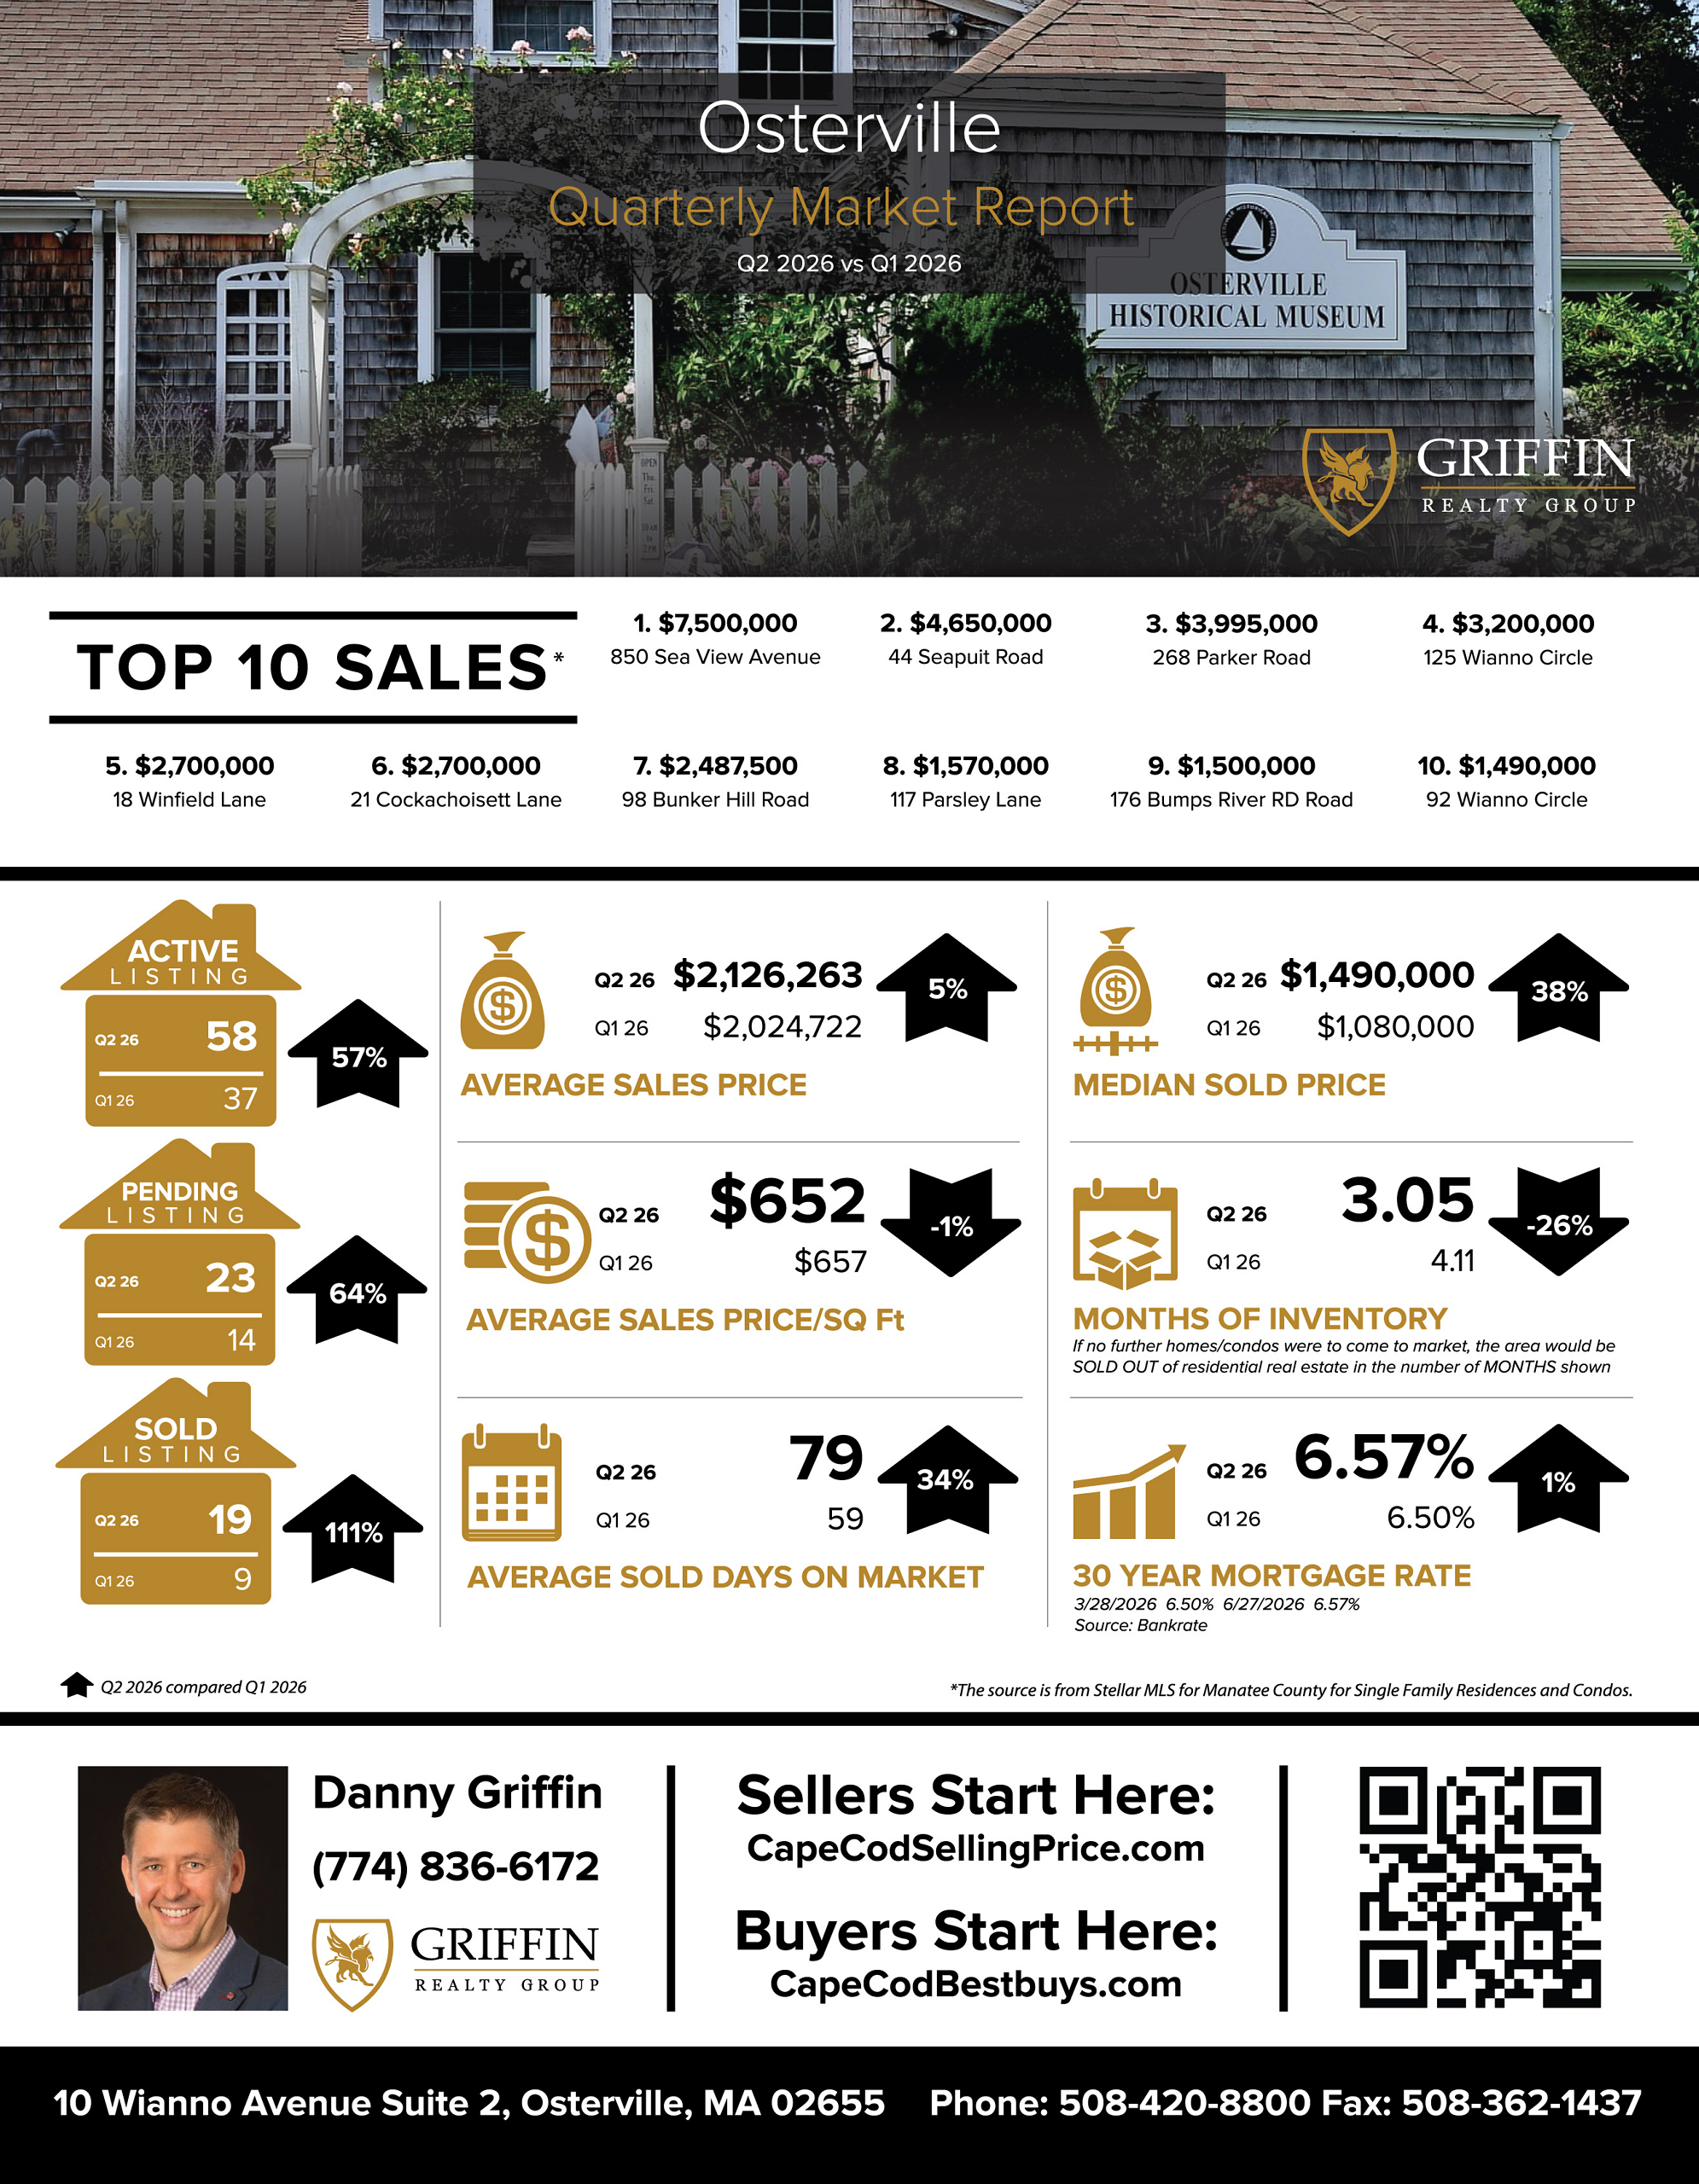
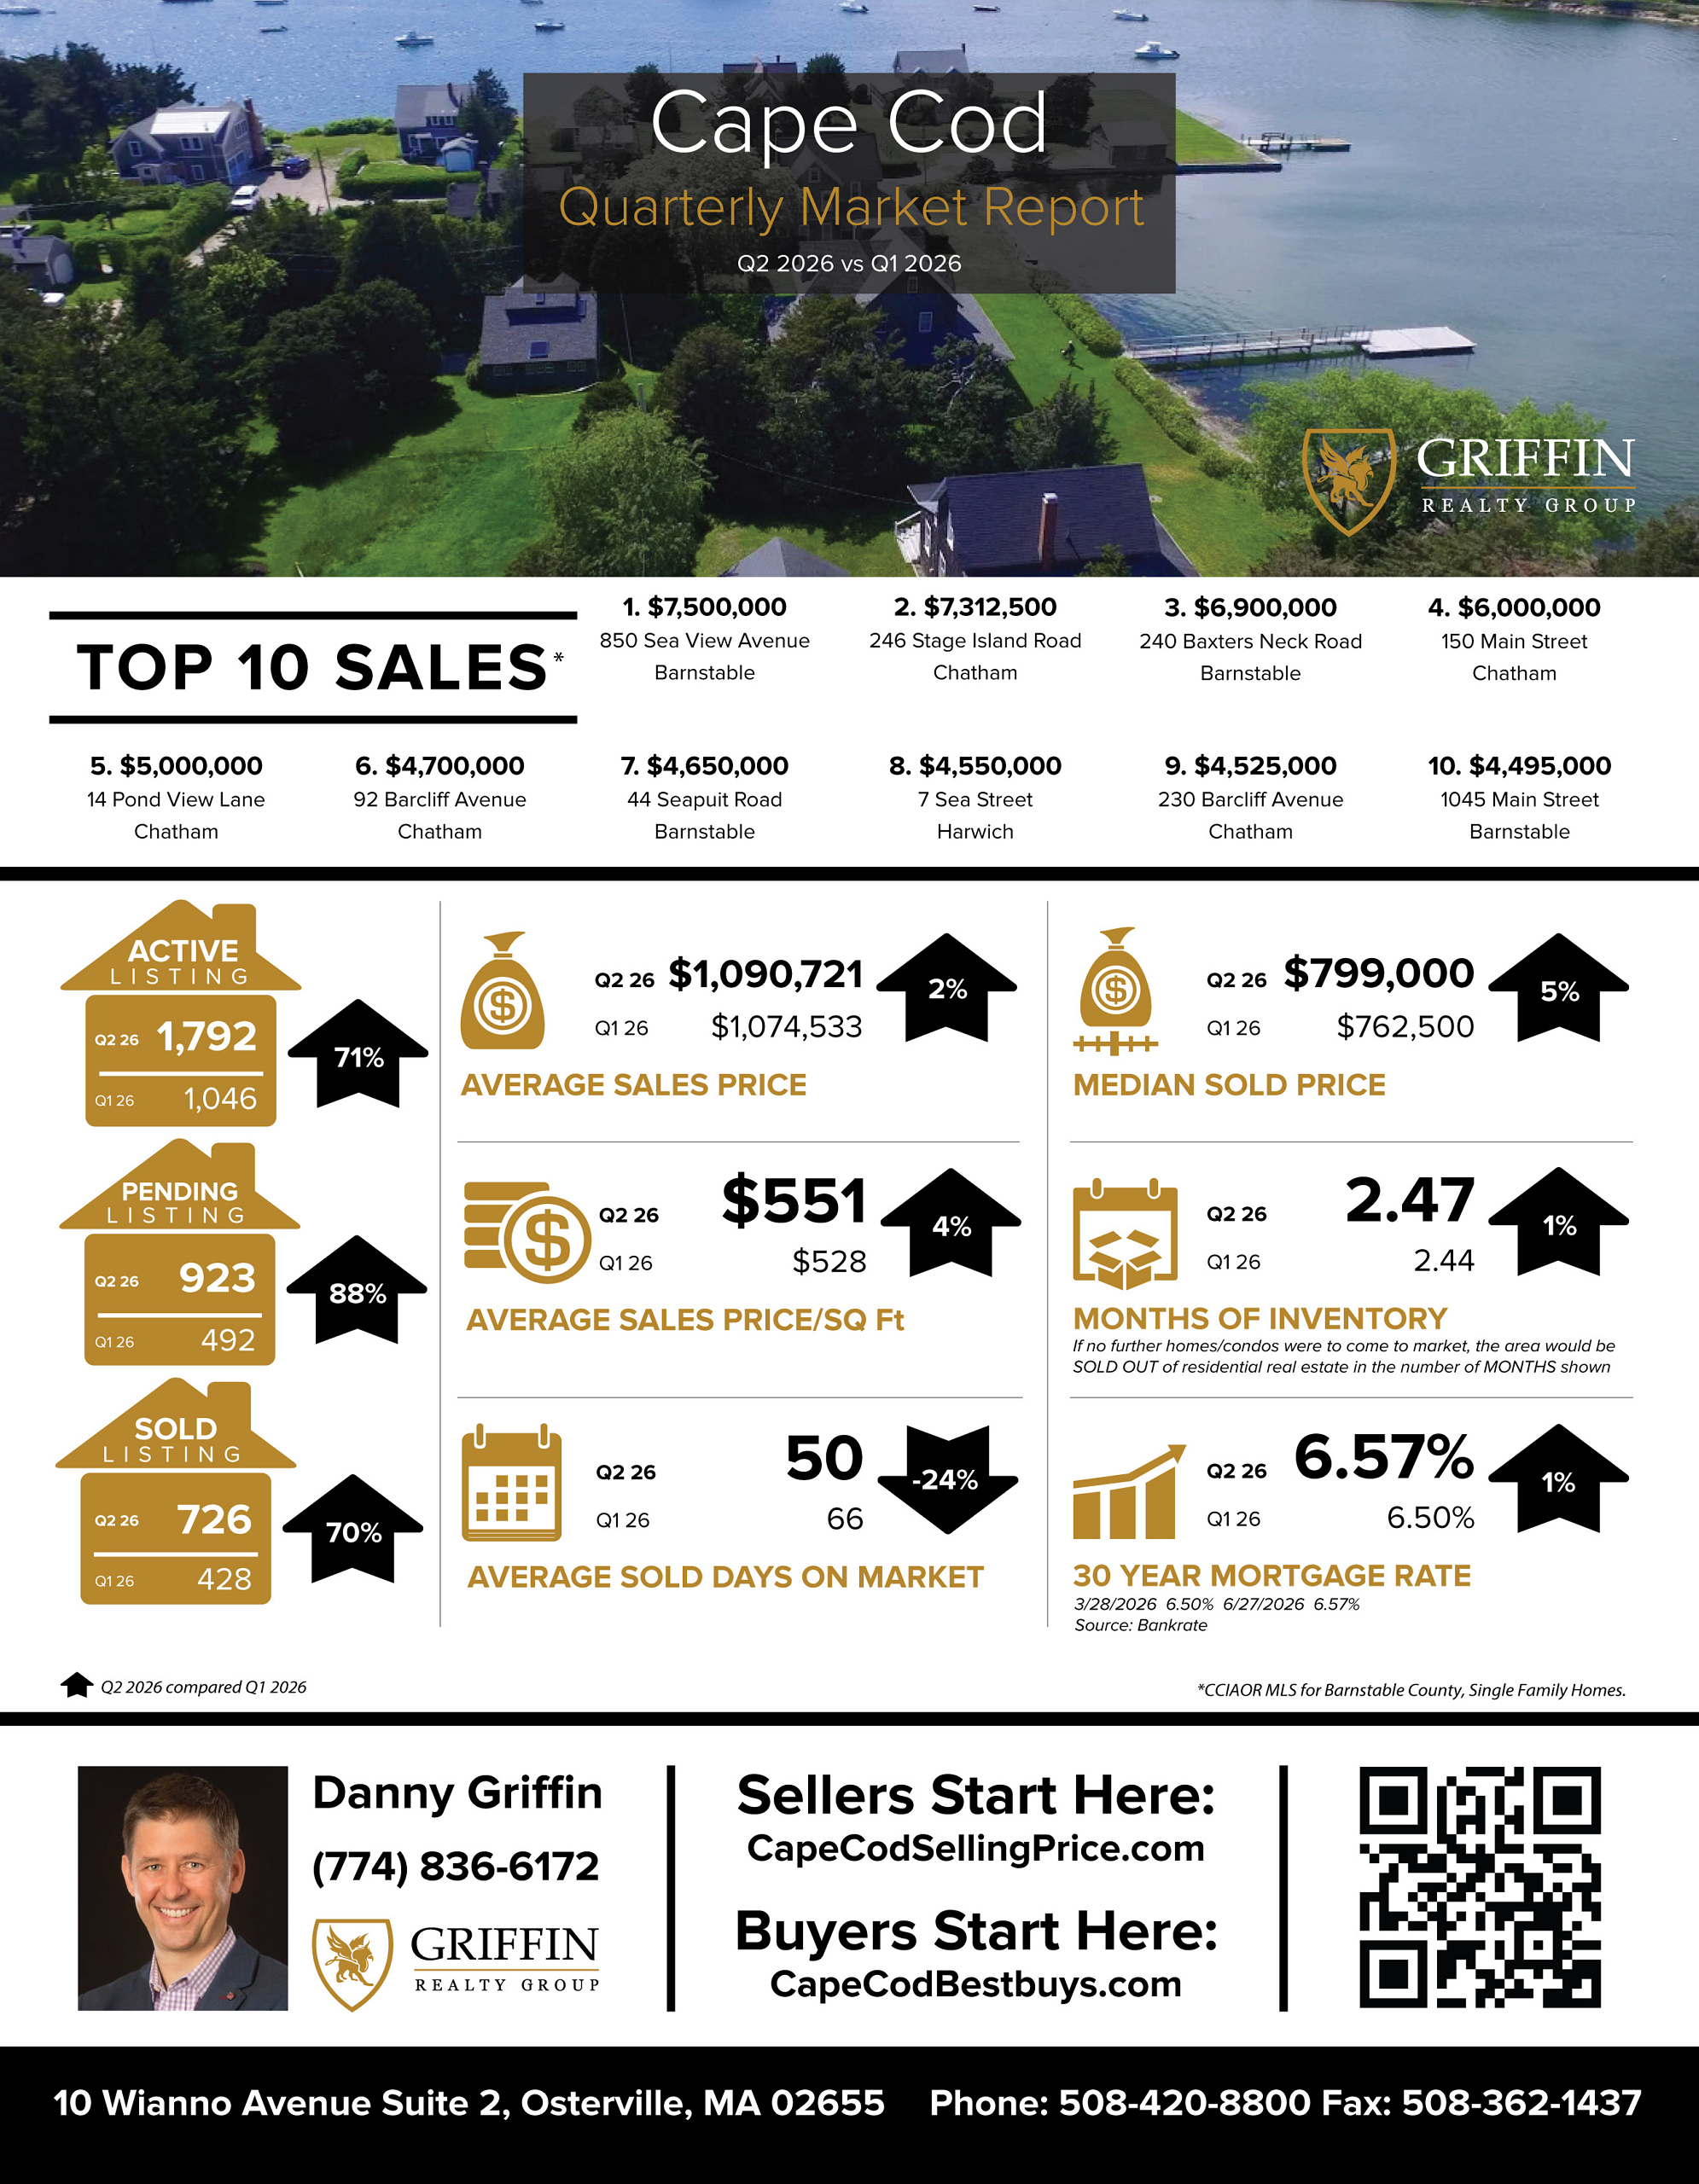
Average Sales PriceApril 2026 – $1173382May 2026 – $101537613% down Average Days On MarketApril 2026 – 79May 2026 – 4148% down Average Sale Price Per Square FootApril 2026 – $589May 2026 – $521.9311% down Median Sales PriceApril 2026 – $834000May 2026 – $7740007% down Number of Sold ListingsApril 2026 – 139May 2026 – 25785% up […]
Access full property details and exclusive listings.
By providing your number, you are expressly consenting, in writing, to receive telemarketing and other messages, including artificial or prerecorded voices, via automated calls or texts fromthegriffin.coat the number you provided above. This consent is not required to purchase any good or service. Message and data rates may apply, frequency varies. Text HELP for help or STOP to cancel. More details inTerms of UseandPrivacy Policy.