
Welcome to The Griffin Real Estate Market Update.
If you’re thinking about buying or selling residential real estate, it’s important to understand the current market trends.
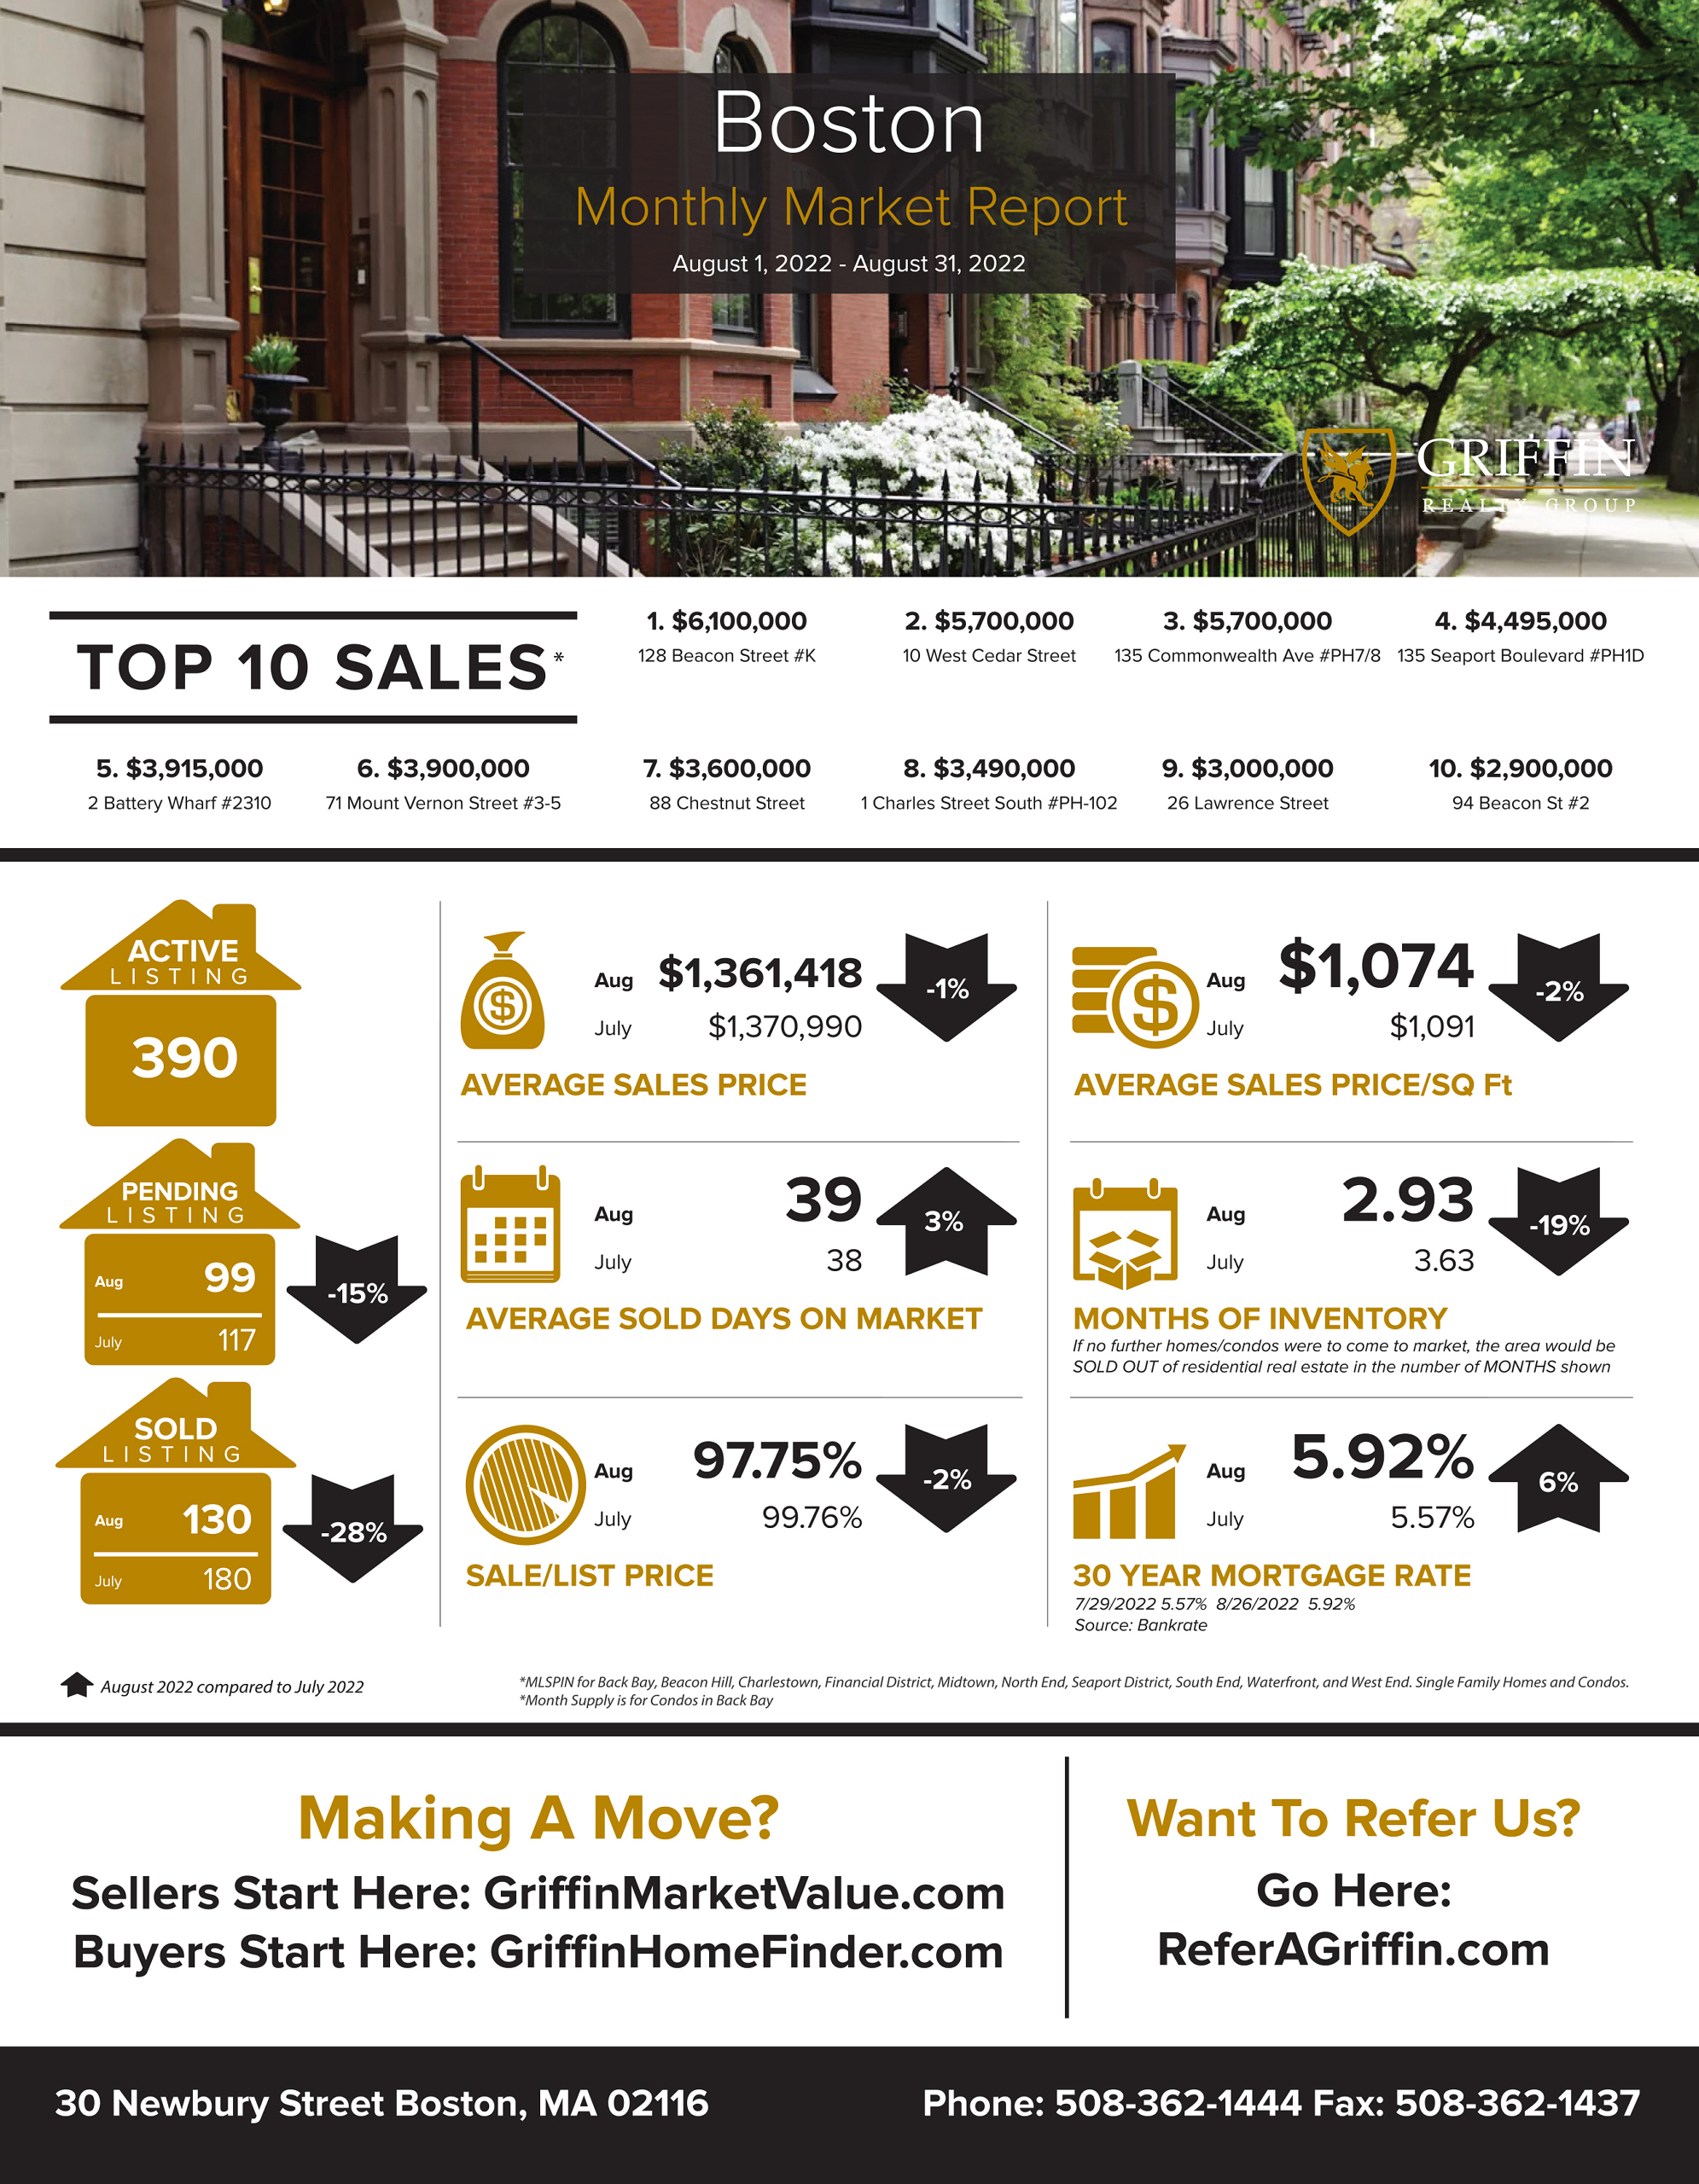
According to MLSPIN, the marketplace for Boston residential properties, here’s what happened in August 2022 versus July 2022:
The Number of SOLD listings decreased by 28% to 130 properties with a top sale of $6.1 million at 128 Beacon Street #K in Boston.
The Average Sales Price decreased by 1% to $1.36 million moving the Average Price Per Square Foot down to $1074 per square foot.
The inventory of properties available for sale as measured in months supply decreased by 19% to 2.93 months worth of properties for
sale.
The average 30 year fixed mortgage rate increased to 5.57% according to Bank Rate.com.
Boston
Average Sales Price
July 2022 – $1370990.12
August 2022 – $1361418.12
decreased by 1%
Average Days On Market
July 2022 – 38
August 2022 – 39
increased by 3%
Average Sale Price Per Square Foot
July 2022 – $1091.41
August 2022 – $1073.93
decreased by 2%
Sale to List Price Ratio
July 2022 – 99.76%
August 2022 – 97.75%
decreased by 2%
Number of Sold Listings
July 2022 – 180
August 2022 – 130
decreased by 28%
Months Supply of Inventory
July 2022 – 3.63
August 2022 – 2.93
decreased by 19%
Mortgage Rate
July 2022 – 5.92%
August 2022 – 5.57%
6% increased
Top 10 Sales
- $6100000 128 Beacon Street #K Boston, MA
- $5700000 10 West Cedar Street Boston, MA
- $5700000 135 Commonwealth Ave #PH7/8 Boston, MA
- $4495000 135 Seaport Boulevard #PH1D Boston, MA
- $3915000 2 Battery Wharf #2310 Boston, MA
- $3900000 71 Mount Vernon Street #3/5/2022 Boston, MA
- $3600000 88 Chestnut Street Boston, MA
- $3490000 1 Charles Street South #PH-102 Boston, MA
- $3000000 26 Lawrence Street Boston, MA
- $2900000 94 Beacon St #2 Boston, MA
GRAB OUR FREE COURSES 6 Steps To Home Buyer Success – http://griffinbuyercourse.com 7 Steps To Home Seller Plan – http://griffinsellercourse.com 8 Steps To Agent Success – http://griffinagentcourse.com


