
Welcome to The Griffin Real Estate Market Update,
If you’re thinking about buying or selling residential real estate, it’s important to understand the current market trends.
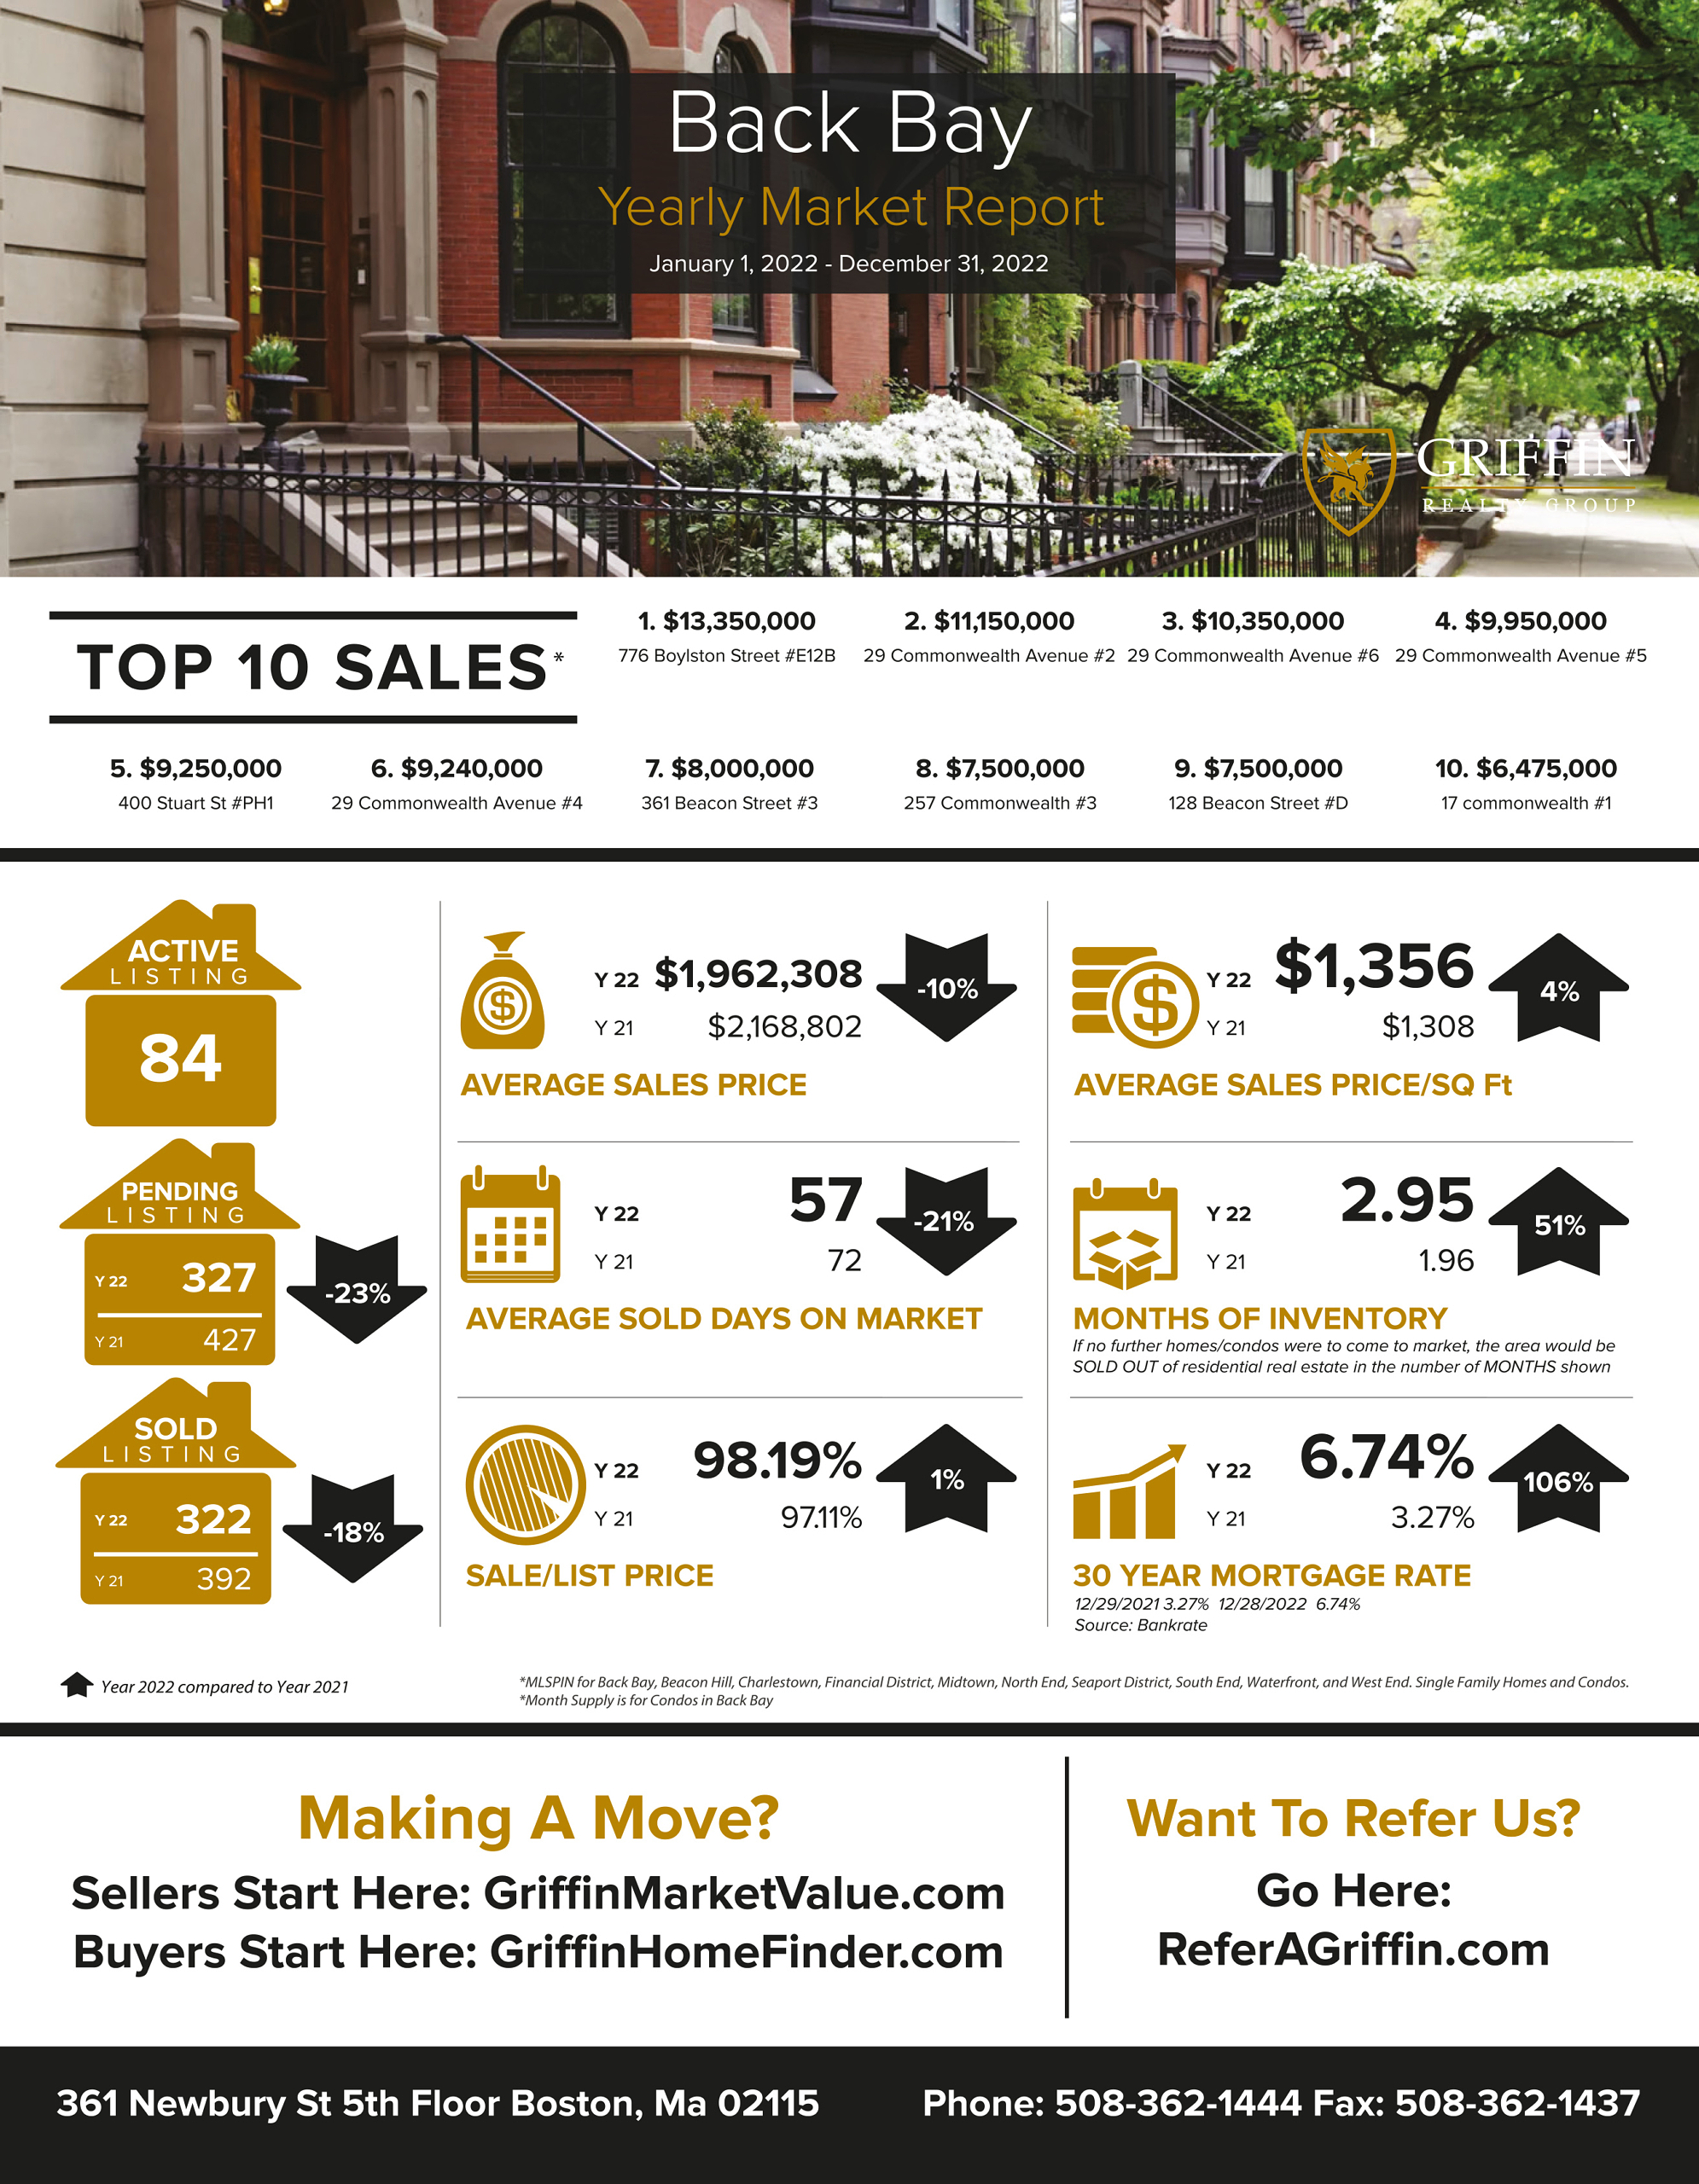
According to MLSPIN, the marketplace for Back Bay residential properties, here’s what happened in 2022 versus 2021:
The Number of SOLD listings decreased by 18% to 322 properties with a top sale of $13.35 million at 776 Boylston Street #E12B in Boston.
The Average Sales Price decreased by 10% to $1.96 million moving the Average Price Per Square Foot up to $1356 per square foot.
The inventory of properties available for sale as measured in months supply increased by 51% to 2.95 months worth of properties for sale.
The average 30 year fixed mortgage rate increased to 3.27% according to Bank Rate.com.
Thanks for tuning in, we’ll see you in the next Griffin Real Estate Market Update.
Back Bay
Average Sales Price
2021 – $2168802.09
2022 – $1962308.43
decreased by 10%
Average Days On Market
2021 – 72
2022 – 57
decreased by 21%
Average Sale Price Per Square Foot
2021 – $1307.61
2022 – $1355.58
increased by 4%
Sale to List Price Ratio
2021 – 97.11%
2022 – 98.19%
increased by 1%
Number of Sold Listings
2021 – 392
2022 – 322
decreased by 18%
Months Supply of Inventory
2021 – 1.96
2022 – 2.95
increased by 51%
Mortgage Rate
2021 – 6.74%
2022 – 3.27%
106% increased
Top 10 Sales
- $13350000 776 Boylston Street #E12B Boston, MA
- $11150000 29 Commonwealth Avenue #2 Boston, MA
- $10350000 29 Commonwealth Avenue #6 Boston, MA
- $9950000 29 Commonwealth Avenue #5 Boston, MA
- $9250000 400 Stuart St #PH1 Boston, MA
- $9240000 29 Commonwealth Avenue #4 Boston, MA
- $8000000 361 Beacon Street #3 Boston, MA
- $7500000 257 Commonwealth #3 Boston, MA
- $7500000 128 Beacon Street #D Boston, MA
- $6475000 17 commonwealth #1 Boston, MA
GRAB OUR FREE COURSES
➡ 6 Steps To Home Buyer Success – http://griffinbuyercourse.com
➡ 7 Steps To Home Seller Plan – http://griffinsellercourse.com
➡ 8 Steps To Agent Success – http://griffinagentcourse.com


